If you use any websites that rely on Flash, such as i-Ready, you may have discovered they have trouble on chromebooks. This is because Flash has been slowly going away for a few years now and Google finally disabled it. They're not alone. Apple did this with Safari in June 2016 and iPhones way back in 2007. FireFox will be doing it in 2017.
If you need to keep Flash running on a chromebook for a bit longer, you can do it using the directions below.
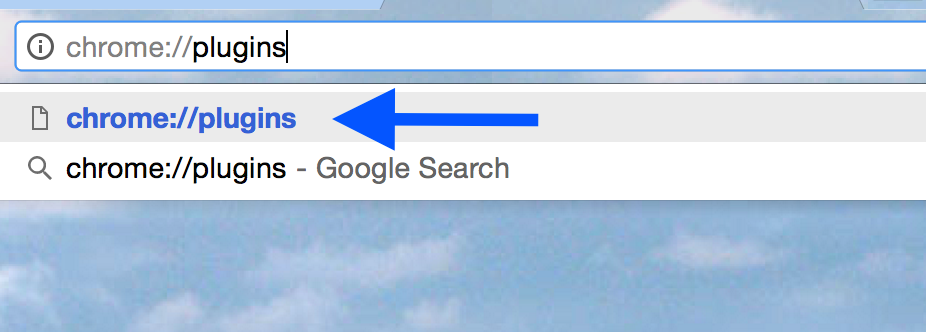
Open a new tab and go to "chrome://plugins".
Look for "Adobe Flash Player" and check "Always allowed to run".
If you're using a Mac and it goes to the screen saver or goes to sleep, sometimes it will "lock." When it wakes up, it will ask for your password to unlock. It just wants to make sure that you're really you and not someone who sneaked up while you were out of the room.
If this feature is getting in the way, you can adjust it.
First, go to the Apple menu and select System Preferences.
Next, click on the "Security & Privacy" icon.
Lastly, make the adjustments you want. This could include lengthening the delay so it is 15 minutes or even an hour instead of 5. You could even turn it off entirely.
LucidChart just added a new feature to make presenting charts more interesting.
First, you use LucidChart to make a mind-map, flow chart, food web, organizational chart, or some other chart. Then you designate areas of the chart as "slides." When you're ready to present the chart, LucidCharts will zoom in to the first slide, then the second, and so on.
For a better explanation, check out this one minute video.
If you're familiar with Prezi, this is similar. Unlike Prezi, LucidChart can store its files inside Google Drive, right next to your other files. LucidChart is also capable of more complex charts and making charts for printing.
To give this a try, just go to your Drive and click on "New". Then go to "More" and "Lucidchart".
If you want an easy-to-build, "Jeopardy"-like game show to run in class, check out Flippity Quiz Show.
Just click on "this template" and then "Make a copy" and you'll get a spreadsheet.
Change the headers from "Category1", etc. to the categories that you want to use.
The lines have labels like "100Q" to show that its the 100 point Question or "100A" for the 100 point Answer. Change the questions and answers (and categories) to suit your needs.
When you're done, click on "Get the Link Here" at the bottom of the screen. Follow those directions, and you'll get a link named "Click here to go to your Flippity Quiz Show".
When its time to run the game show, turn on your projector, open this file, and click on the link. That will open up your quiz show. The quiz show can have up to six teams by using the "+" and "-" buttons at the bottom of the screen.
You can now have a custom icon for yourself (a.k.a. avatar) in Google Classroom. This personalizes your online classroom a bit and gives a little visual feedback to students by putting your avatar next to anything you write.
If you want to use a custom avatar, you can set it up with the following steps.
Pick out your avatar. This can be any photo you took with your phone, found online, or anywhere else. For a professional look, use a photo like those on ID badges or in the yearbook.
Click on the icon in the upper-left corner that looks like three horizontal lines. A menu will slide out of the left side of the page.
Click on "Settings" at the bottom of the panel.
Click on "Change profile picture".
Follow the on-screen steps for selecting your photo. If its on your phone, you might need to email it to yourself and then download it on the computer.
That is it. Once its set up, every classroom, announcement, assignment, and comment you make will have your avatar next to it.
If you've ever needed a quick way to build a small sign or flier quickly, give PikToChart.com a try. It provides a way to build "infographics" - highly visual documents that communicate tips and/or data. It lets you quickly make things like this:
Some ways to use PikToChart include making a sign for your classroom, a flier for an event, or having students color code maps as an assignment. Students can even research a topic and build an infographic as a summary of their research or as a presentation tool.
You're now logged in and ready to go. Pick a template, drop in your material, and go. Adding things is just point-and-click. Objects can be moved around the page with a simple click-and-drag.
When you're done, use the "Download" button on the top right to keep a copy. You can put that file in email, Google Classroom, or share it on social media.


.PNG)


